

本文目前仅提供英文版本。查看英文版 →
A 24-in-1 screwdriver set goes viral on TikTok Shop US. Within a week, the support inbox gets a question it has never seen before: “What’s the difference between the hex bit and the star one?” The people who used to buy that set were electricians and repair techs. The new buyers found it in a creator’s 15-second video.
Customer inquiry volume is the number of questions, requests, and complaints customers send to a business across every support channel in a set period, usually counted per day or week and often expressed per 100 orders. Counting it is easy. Predicting it is harder, because it depends on who’s buying, not just how many orders ship.
This guide covers what the number means, a formula you can run on your own data, why a creator-driven spike changes the kind of questions you get, and four ways to cut them before they reach a queue.
On this page
- TL;DR
- Definition
- Estimation
- Why a viral sales spike changes who contacts you
- Four ways to cut inquiry load at the source
- The questions you can’t prevent
- How to know it worked
- FAQ
TL;DR
Most brands plan for the order number and assume the contact rate stays flat.
It doesn’t. Inquiry volume is orders multiplied by contacts per order, and a viral sales spike changes both numbers at once: it adds orders, and it adds first-time buyers who need more help per order than the customers you had before.
So the fix isn’t only more seats. It’s removing the reasons new buyers have to ask. Here’s where each common spike inquiry should be handled:
| What the customer asks | Root cause | Where to cut it | Who handles what’s left |
|---|---|---|---|
| ”How do I use it?” | Product is new to the buyer | Send the creator’s demo clip as the answer | Any trained human agent |
| ”I’m missing a part” | Multi-part kit, loose packing | Replacement flow tied to a SKU list | A human agent allowed to ship the part |
| ”I can’t tell which part I need” | Buyer doesn’t know the terms | Category training plus a SKU chart | A human agent trained on the category |
| ”Where’s my order?” | Shipping, not the product | Order lookup inside the help desk | Automation first, a person on the second ask |
What is customer inquiry volume?
Inquiry volume counts the distinct questions customers bring to you, whatever channel they use and however many times they follow up. It’s the demand side of support. Ticket volume and contact volume measure the same demand from different angles, and they drift apart fast.
That’s the customer inquiry volume definition most teams need. The confusion comes from counting three different things and calling all of them the same thing:
| Metric | What it counts | What inflates it | Question it answers |
|---|---|---|---|
| Inquiry count | Underlying customer questions, de-duplicated | New buyer types, product complexity | ”Why do customers need us?” |
| Contact count | Every call, email, chat, and DM | Slow replies, channel switching, repeat follow-ups | ”How busy are the lines?” |
| Ticket count | Records in the help desk | Merge rules, auto-created tickets, agents splitting threads | ”How much work sits in the queue?” |
Ticket volume counts records in a help desk, contact volume counts every call, email, and chat, and inquiry volume counts the underlying customer questions. One missing screwdriver bit can produce three contacts and two tickets. It’s still one inquiry.
If you switch help desks, change merge rules, or add a chat widget mid-quarter, your ticket count will jump even if customers asked nothing new. That’s why the trend line breaks. Count each customer problem once, then tag it with a reason. The reason tag is the part you’ll use later.
How to estimate inquiries before a spike
Customer inquiry volume estimation takes three steps: measure your own contacts per order, multiply it by your order forecast, and adjust for changes in who’s buying. The last step is the one most forecasts skip, and it’s where a spike does its damage.
Step 1: Find your baseline contact rate. Divide inquiries by orders from the same window, say the last 8 weeks. 3,900 inquiries on 12,000 orders is 32.5 per 100 orders.
Step 2: Multiply by the order forecast. Every staffing model already has it.
Step 3: Adjust for buyer mix. A new kind of buyer makes your old rate the wrong input. Use the rate from your last new-channel spike, or track the new channel by reason for 2 weeks first.
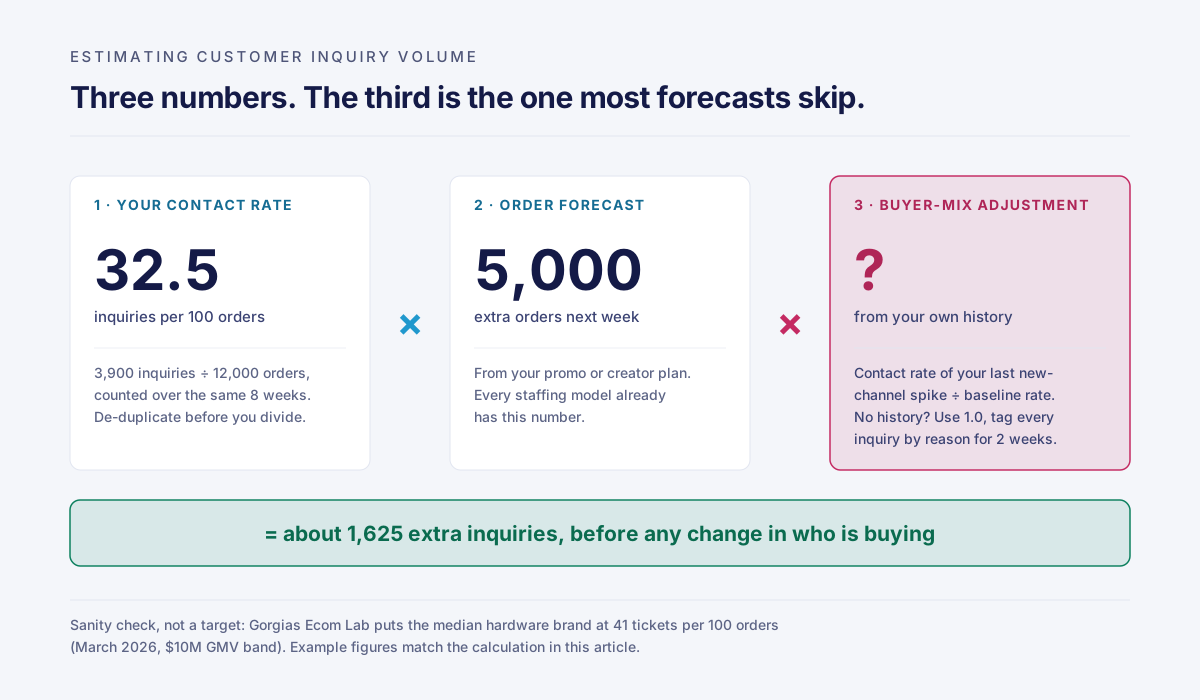
Industry figures help as a sanity check, not as a target. According to Gorgias’s own platform data (median tickets per 100 orders at the US$10M GMV band, March 2026), the median hardware brand receives 41 support tickets for every 100 orders, so a store that ships 5,000 extra orders in a week should plan for roughly 2,000 extra tickets before any change in who is buying. Gorgias itself says to benchmark this number against yourself.
| Vertical | Median tickets per 100 orders |
|---|---|
| Electronics | 46 |
| Hardware | 41 |
| Home & Garden | 32 |
| Apparel & Accessories | 22 |
| Health & Beauty | 21 |
| Toys & Games | 19 |
Source: Gorgias Ecom Lab, median at US$10M GMV, March 2026. Gorgias sells help desk software.
The same math as a script:
def forecast_inquiries(baseline_orders, baseline_inquiries, forecast_orders, mix_adjustment=1.0):
    """Inquiry forecast for a promo week or a creator campaign."""
    # Baseline orders and inquiries must come from the SAME time window.
    contacts_per_order = baseline_inquiries / baseline_orders
    # mix_adjustment comes from YOUR history: the contact rate of the last
    # new-channel spike divided by your baseline rate. No history? Keep 1.0,
    # tag every inquiry by reason, and replace it after 2 weeks of data.
    return forecast_orders * contacts_per_order * mix_adjustment

print(f"Plan for about {forecast_inquiries(12_000, 3_900, 5_000):,.0f} extra inquiries")  # 12,000 orders, 3,900 inquiries, 5,000 extra -> 1,625
The impact of buyer mix shows up in the reason split, not the total. A spike can double how-to questions while order-status questions stay flat. Forecast by reason and you’ll see which line moved.
Why a viral sales spike changes who contacts you
A seasonal peak brings more of the same customers; a creator-driven spike on TikTok Shop brings different customers. First-time buyers who can’t tell a hex bit from a Torx bit, or a T10 from a T15, generate inquiries that experienced buyers never send.
Black Friday changes how many people buy. A viral video changes who is buying. That difference decides whether more seats will fix the problem.
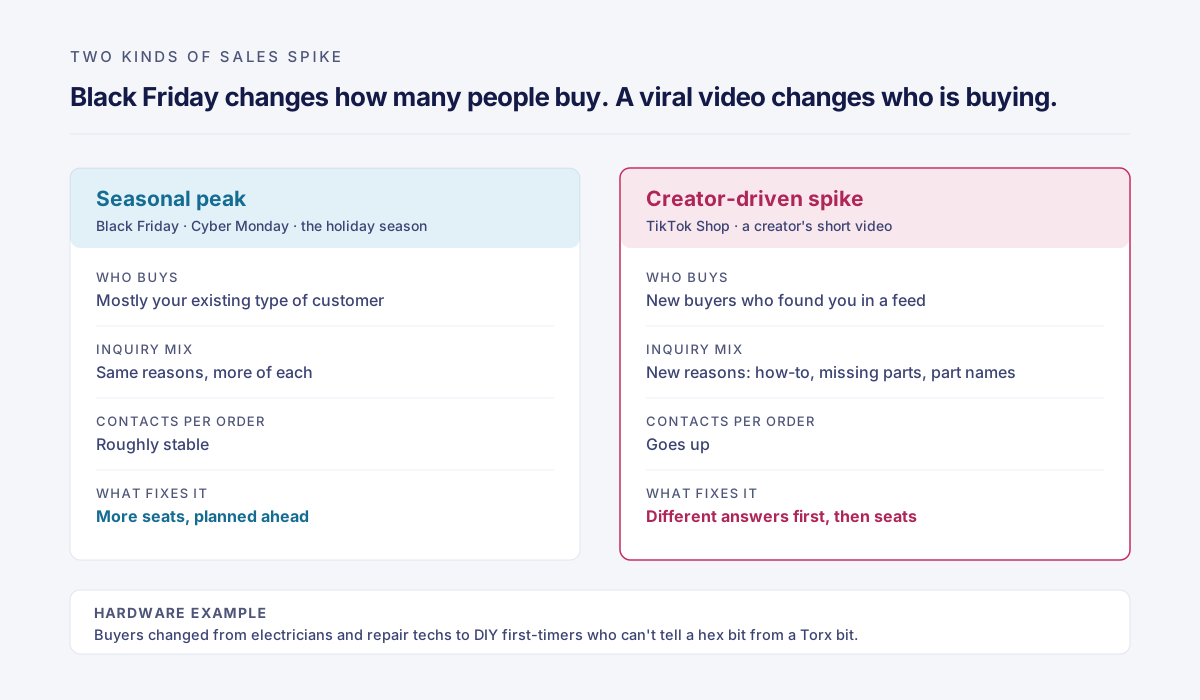
The hardware case is the clearest one we’ve seen. A hardware-tools brand we support (unnamed) sold a multi-bit screwdriver kit through TikTok creators. The buyers weren’t tradespeople anymore. They were DIY beginners, and three questions took over the inbox:
| What they wrote | The real question | The default reply | What happened next |
|---|---|---|---|
| ”How do I use this?” | Show me, don’t tell me | ”Please see the manual.” | A 1-star review |
| ”I’m missing a part.” | Can you send just that piece? | ”Parts aren’t sold separately.” | No repeat purchase |
| ”I don’t know which bit is missing.” | Help me name it | A question back about the part number | 3 to 5 emails back and forth |
None of these questions are hard. They’re just new, and the old answers were written for buyers who already knew the product.
A manual doesn’t stop people from calling. In a Harvard Business Review study of more than 75,000 B2C and B2B customers (Customer Contact Council, published 2010), 57% of inbound calls came from customers who went to the website first. The answer existed. The customer couldn’t use it.
We’ve seen the same pattern outside retail: a spa that went viral on TikTok got booking questions from people who’d never booked a treatment before. For how the comment and DM side of that traffic works, see our guide to social media customer service. And for how a planned peak behaves differently, read about the Prime Day queue problem.
Callnovo.ai ran the hardware account from the Philippines, and the fixes below came out of that engagement.
Four ways to cut inquiry load at the source
Only 14% of customer service issues are fully resolved in self-service, according to a 2024 Gartner survey of 5,728 customers, which is why cutting inquiry load at the source means changing the answer, the replacement process, and what human agents are allowed to do, rather than adding another FAQ page.
Each lever below matches one of the spike questions.
| Lever | Inquiry it removes | What the brand provides | Case result | Independent evidence |
|---|---|---|---|---|
| Video answers | ”How do I use it?” | Rights to creator clips | How-to inquiries down 42% | Bell Canada: calls per event down 16% (HBR, 2010) |
| SKU replacement flow | ”I’m missing a part” | Parts list, warehouse access | Replacement handling began in 20 seconds, down from 3 hours; satisfaction 96% | — |
| Human agent authority | Escalations and repeat contacts | Written limits for reships and refunds | Handling time 28 → 11 minutes; 89% first-contact resolution | Australian telco: repeat calls down 58% (HBR, 2010) |
| Feedback to product | The top recurring reason | Willingness to change packaging | No count published | — |
Lever 1: Answer “how do I use it?” with the video that sold it
The buyer already watched a 15-second demo. That’s why they bought. So the human agents on the hardware account put that same clip into their reply macros, and a “how do I use this?” question got the video instead of a manual link.
How-to inquiries fell 42%. There’s outside evidence for the mechanism too. Bell Canada had its reps give a quick tutorial on a new feature before ending the call, and HBR reported that this cut “calls per event” by 16% and churn by 6%.
Lever 2: Turn “I’m missing a part” into a SKU lookup, not an email thread
A 24-bit kit has 24 ways to be incomplete. We helped the brand build a SKU list of all 24 parts, so when a customer said a bit was missing, a human agent could identify the part, check stock in the overseas warehouse, and trigger the reship directly.
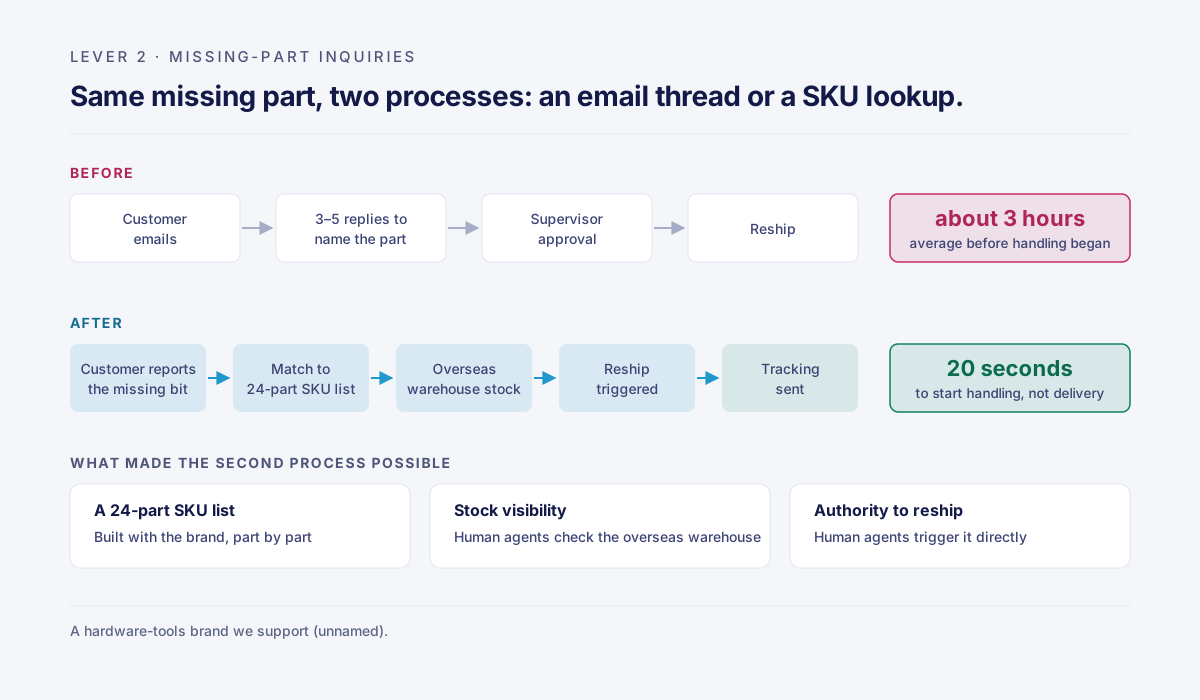
Average time to start handling a replacement dropped from 3 hours to 20 seconds, and satisfaction rose to 96%. The 20 seconds is when the human agent began the replacement, not when the part arrived.
Category training handled the “I can’t tell which part” questions. Agents in the Philippines learned the difference between hex and Torx, and between T10 and T15, in the words US DIY buyers use. Average complaint handling time went from 28 minutes to 11, and first-contact resolution reached 89%.
Lever 3: Give agents authority to ship and refund
If a human agent can’t send a single bit without a supervisor’s sign-off, every missing part becomes an escalation. The customer waits, then writes again. Now one inquiry is two or three contacts.
Callnovo.ai agents on the account were trained on the brand’s 24-part SKU list and allowed to trigger a replacement directly from the overseas warehouse. The principle we took from that account is simple: if human agents can’t reship or refund, every question in a spike gets escalated up the chain, and new buyers won’t wait that long.
The HBR study has a sharper version of this. An Australian telecom removed all productivity metrics from its frontline reps’ scorecards. Handle time rose slightly, and repeat calls fell 58%.
Lever 4: Send the top inquiry reasons back to product and packaging
Some questions can’t be answered away. They have to be designed away. On a smart coffee machine account, our frontline team kept logging the same “broken” reports: a shipping plug nobody removed, and a first-use priming step nobody knew about. The brand put a startup card on top of the packaging.
Why self-service alone won’t carry a spike
A knowledge base works best for buyers who know what to search for. In the same Gartner survey, even issues customers called “very simple” were fully resolved in self-service only 36% of the time, and more than 43% of failures came from not finding relevant content. A deflection rate counts conversations that ended, not problems that got solved.
The questions you can’t prevent still need a reply within 24 hours
TikTok Shop’s US customer service policy requires sellers to respond to all inquiries within 24 hours, so a creator-driven spike leaves a brand with days, not weeks, to put trained human agents in front of new buyers.
After you cut what you can, high inquiry volumes during a spike still need people. That response time SLA doesn’t care whether the backlog came from a video or a holiday. For the share of that volume that arrives by phone, the Erlang calculator turns calls per interval, handle time, and a service level target into the number of agents to schedule. There are two ways to add staffing:
| Hire in-house | Add outside seats | |
|---|---|---|
| Time to live agents | Weeks to months (recruiting, onboarding) | Days, if the vendor already employs trained staff |
| Who trains | Your team, during your busiest week | Vendor, from your product docs and SKU list |
| After the spike | Layoffs or idle payroll | Seats scale back |
| Better when | The spike becomes your new normal | The spike is short or you can’t tell yet |
If the spike turns into your new normal, hiring in-house is usually the right call. You’ll want that product knowledge on payroll.
For outside seats, here’s how fast Callnovo.ai can put human agents live. These times don’t include connecting to your systems:
| Team size | Agents live in |
|---|---|
| 1–5 | 3 days |
| 6–10 | 5 days |
| 11–20 | 10 days |
| 21–50 | 15 days |
| 51–100 | 20 days |
Callnovo.ai scales Q4 teams by 50–100% within two weeks and scales them back in January without a break in service. Callnovo.ai has human agents in 65+ languages across 35+ contact centers in 26 delivery countries. More than 90% of them work from offices, not from home. HeroDash, our support platform, is an authorized TikTok Shop Partner (ISV). It can connect to TikTok Shop, Shopify, and Amazon. So the order in TikTok Shop Seller Center or Shopify Admin sits next to the conversation about it. Our rates are public. Run the numbers before you call anyone.
More on this model: ecommerce customer service outsourcing, ecommerce call center outsourcing, and how to hire your own dedicated team. If you sell gadgets or tools with lots of parts, see our electronics support page.
Sorting and assigning inquiries once they arrive is covered in ticket triage and routing.
How to know it worked
Track inquiry volume per 100 orders by reason code, not as a single total, because a spike can raise how-to questions while lowering order-status questions, and the total alone will hide both changes. Good inquiry management starts with a reason code, not a headcount.
Pair the reason split with three measures from your help desk:
- First-contact resolution (FCR): the share of inquiries solved in the first contact. If it’s low, customers are writing back.
- Handle time: how long each inquiry takes. Watch it for drift, but don’t grade people on it. The Australian telecom result is why.
- Re-contact rate: how often the same customer comes back about the same order. This is the honest number, and CSAT won’t show it.
Use this checklist for the next spike:
- Tag every inquiry with one reason code before you count anything
- Compute contacts per 100 orders by reason for the last 8 weeks
- Clip the 3 most-asked demos from your creators’ videos and add them to reply macros
- Turn every multi-part product into a SKU list with photos
- Write down the reship and refund limits human agents can approve without a supervisor
- Check your TikTok Shop 24-hour response rate daily during the spike
- Track the new channel’s contact rate separately for 2 weeks
- Send the top 5 inquiry reasons to product and packaging every week
Three questions before your next spike
- Do you know your contacts per 100 orders, split by reason? If the answer is no, your forecast is a guess, and you’ll staff for the wrong inquiries.
- Can a human agent ship a missing part without asking anyone? If the answer is no, every missing part will turn into two or three contacts, and your queue will grow faster than your orders.
- Is your next sales push coming from a new kind of buyer? If the answer is yes, your old contact rate is the wrong input, and the how-to answers need to be ready before launch.
If you want a second pair of eyes, send us the reason split from your last spike. We’ll tell you which inquiries could have been cut at the source.
References
- Dixon, M., Freeman, K., & Toman, N. Stop Trying to Delight Your Customers. Harvard Business Review, July–August 2010. https://hbr.org/2010/07/stop-trying-to-delight-your-customers
- Gartner. Gartner Survey Finds Only 14% of Customer Service Issues Are Fully Resolved in Self-Service, press release, August 19, 2024. https://www.gartner.com/en/newsroom/press-releases/2024-08-19-gartner-survey-finds-only-14-percent-of-customer-service-issues-are-fully-resolved-in-self-service
- CX Today. Only 1 in 7 Customer Service Queries Resolved with Self-Service, Gartner Study Finds, August 2024. https://www.cxtoday.com/contact-center/only-1-in-7-customer-service-queries-resolved-with-self-service-gartner-study-finds/
- Gorgias. Customer support metrics (Gorgias Ecom Lab, tickets per 100 orders, March 2026)
- TikTok Shop Seller University (US). Customer Service Policy. https://seller-us.tiktok.com/university/essay?knowledge_id=7454760317110062
- TikTok Shop Seller University (US). Requirements for the 24-Hour Response Rate Metric. https://seller-us.tiktok.com/university/essay?knowledge_id=719928765302570